ملف:Ukrainian parliamentary election, 2007 (SwingByRegion).PNG

Ukrainian_parliamentary_election,_2007_(SwingByRegion).PNG(767 × 477 بكسل حجم الملف: 16 كيلوبايت، نوع MIME: image/png)

ملخص

الوصف
التاريخ
المصدر Self-made based off map by Muumi with data from Central Election Commission of Ukraine
المؤلف User:DemocracyATwork
الترخيص
(إعادة استخدام هذا الملف)
w:ar:مشاع إبداعي
نسب العمل إلى مُؤَلِّفه الإلزام بترخيص المُشتقات بالمثل
نسب العمل لمُؤَلِّفه: DemocracyATwork
يحقُّ لك:
  • مشاركة العمل – نسخ العمل وتوزيعه وبثُّه
  • إعادة إنتاج العمل – تعديل العمل
حسب الشروط التالية:
  • نسب العمل إلى مُؤَلِّفه – يلزم نسب العمل إلى مُؤَلِّفه بشكل مناسب وتوفير رابط للرخصة وتحديد ما إذا أجريت تغييرات. بالإمكان القيام بذلك بأية طريقة معقولة، ولكن ليس بأية طريقة تشير إلى أن المرخِّص يوافقك على الاستعمال.
  • الإلزام بترخيص المُشتقات بالمثل – If you alter, transform, or build upon this work, you must distribute the resulting work under the same license as the original.
إصدارات أخرى

Collection

Results of the parliamentary elections:
Politcal alignment 2007
Vote percenatge 2006 to 2007 (Top Six parties)
Swing 2006 to 2007 (Top Six parties)

Regional Analysis of the parliamentary elections:

Highest Vote per region
Charts showing the top six parties support - percentage of total national vote and Electoral Region
Vote Percentage by Electoral Region Vote Percentage by Electoral Region Swing by Electoral Regions
Maps showing the top six parties support - percentage of total national vote
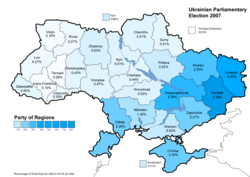
Party of Regions results (34.37%)
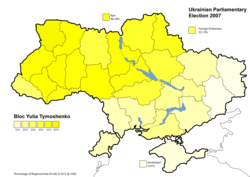
Bloc Yulia Tymoshenko results (30.71%
Our Ukraine People's Self-Defence results (14.15%)
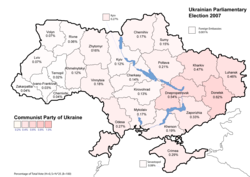
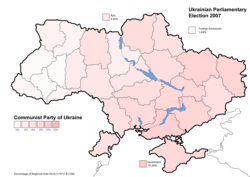
Communist Party of Ukraine results (5.39%)
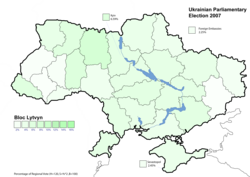
Bloc Lytvyn Party results (3.96%)
Socialist Party of Ukraine results (2.86%)
Maps showing the top six parties support - percentage of total national vote (Minimal text)
Party of Regions results (34.37%)
Bloc Yulia Tymoshenko results (30.71%
Our Ukraine People's Self-Defence results (14.15%)
Communist Party of Ukraine results (5.39%)
Bloc Lytvyn Party results (3.96%)
Socialist Party of Ukraine results (2.86%)
Maps showing the top six parties support - percentage per region
Party of Regions results (34.37%)
Bloc Yulia Tymoshenko results (30.71%
Our Ukraine People's Self-Defence results (14.15%)
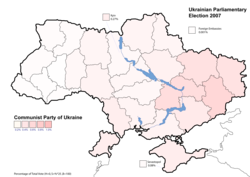
Communist Party of Ukraine results (5.39%)
Bloc Lytvyn Party results (3.96%)
Socialist Party of Ukraine results (2.86%)


2007 [1] [2] [3] [4] [5] [6]

2006 [7] [8] [9] [10] [11] [12]

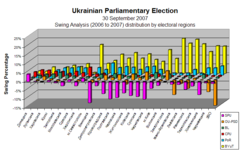
A swing analysis is common in any election. It shows the change in voter percentage for each party by regions from 2006 to 2007.

ترخيص

Public domain أنا، مالِك حقوق تأليف ونشر هذا العمل، أجعله في النِّطاق العامِّ، يسري هذا في أرجاء العالم كلِّه.
في بعض البلدان، قد يكون هذا التَّرخيص غيرَ مُمكنٍ قانونيَّاً، في هذه الحالة:
أمنح الجميع حق استخدام هذا العمل لأي غرض دون أي شرط ما لم يفرض القانون شروطًا إضافية.
  1. Template:Cite gov
  2. Template:Cite gov
  3. Template:Cite gov
  4. Template:Cite gov
  5. Template:Cite gov
  6. Template:Cite gov
  7. Template:Cite gov
  8. Template:Cite gov
  9. Template:Cite gov
  10. Template:Cite gov
  11. Template:Cite gov
  12. Template:Cite gov

الشروحات

أضف شرحاً من سطر واحد لما يُمثِّله هذا الملف

العناصر المصورة في هذا الملف

يُصوِّر

١١ فبراير 2008

تاريخ الملف

اضغط على زمن/تاريخ لرؤية الملف كما بدا في هذا الزمن.

زمن/تاريخصورة مصغرةالأبعادمستخدمتعليق
حالي17:07، 20 فبراير 2008تصغير للنسخة بتاريخ 17:07، 20 فبراير 2008767 × 477 (16 كيلوبايت)DemocracyATworkUkrainian Parliamentary Election 2007 Results of election (Political Swing by region) chart. Removed boarder.
23:10، 17 فبراير 2008تصغير للنسخة بتاريخ 23:10، 17 فبراير 2008748 × 477 (16 كيلوبايت)DemocracyATworkUpdate to reflect color change for Bloc Lytvyn to match with the Parliamentary seat allocation map. From grey to geen.
14:24، 13 فبراير 2008تصغير للنسخة بتاريخ 14:24، 13 فبراير 2008748 × 477 (16 كيلوبايت)DemocracyATwork== Summary == {{Information |Description='''English:''' Ukrainian parliamentary election, 2007 sorted to better correlate to data table. |Source=Self-made based off [[:Image:Wahlkreise ukraine 2006 eng.png|ma
14:36، 6 فبراير 2008تصغير للنسخة بتاريخ 14:36، 6 فبراير 2008748 × 477 (19 كيلوبايت)File Upload Bot (Magnus Manske) {{BotMoveToCommons|uk.wikipedia}} {{Information |Description={{uk|uk:?????????:?????????? 2007 http://www.cvk.gov.ua/pls/vnd2007/W6P320?PT001F01=600&pPlace=1 http://www.cvk.gov.ua/pls/vnd2007/W6P320?PT001F01=600&pPlace=2 http://www.c

الصفحة التالية تستخدم هذا الملف:

الاستخدام العالمي للملف

الويكيات الأخرى التالية تستخدم هذا الملف: