ملف:Sahel rainfall timeseries en.svg

حجم معاينة PNG لذلك الملف ذي الامتداد SVG: 630 × 270 بكسل. الأبعاد الأخرى: 320 × 137 بكسل | 640 × 274 بكسل | 1٬024 × 439 بكسل | 1٬280 × 549 بكسل | 2٬560 × 1٬097 بكسل.
الملف الأصلي (ملف SVG، أبعاده 630 × 270 بكسل، حجم الملف: 25 كيلوبايت)
| هذا ملف من ويكيميديا كومنز. معلومات من صفحة وصفه مبينة في الأسفل. كومنز مستودع ملفات ميديا ذو رخصة حرة. |
W3C-validity not checked.
ملخص
| الوصف |
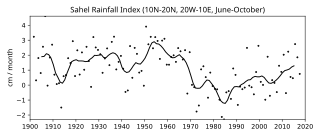
English: More than a century of rainfall data in the Sahel show an unusually wet period from 1950 until 1970 (positive index values), followed by extremely dry years from 1970 to 1990 (negative index values). From 1990 until present rainfall returned to levels slightly below the 1898–1993 average, but year-to-year variability was high. |
| التاريخ | |
| المصدر | Own work, based on JISAO data |
| المؤلف | Benedikt.Seidl |
| الترخيص (إعادة استخدام هذا الملف) |
Image:Sahel rainfall timeseries.gif, Image:Sahel rainfall timeseries de.svg |
ترخيص
| أنا، مالِك حقوق تأليف ونشر هذا العمل، أجعله في النِّطاق العامِّ، يسري هذا في أرجاء العالم كلِّه. في بعض البلدان، قد يكون هذا التَّرخيص غيرَ مُمكنٍ قانونيَّاً، في هذه الحالة: أمنح الجميع حق استخدام هذا العمل لأي غرض دون أي شرط ما لم يفرض القانون شروطًا إضافية. |
تاريخ الملف
اضغط على زمن/تاريخ لرؤية الملف كما بدا في هذا الزمن.
| زمن/تاريخ | صورة مصغرة | الأبعاد | مستخدم | تعليق | |
|---|---|---|---|---|---|
| حالي | 23:19، 23 ديسمبر 2019 | | 630 × 270 (25 كيلوبايت) | Rainald62 | updated, moved title to top, added observational region as defined by the index, added units, changed bar graph to scatter plot (de-emphasizing the arbitrary zero level), added smoothed data as line (7-point cosine kernel). |
| 19:06، 1 يوليو 2008 |  | 706 × 322 (48 كيلوبايت) | Bender235 | {{Information |Description={{en|1=More than a century of rainfall data in the Sahel show an unusually wet period from 1950 until 1970 (positive index values), followed by extremely dry years from 1970 to 1990 (negative index values). From 1990 until prese |
استخدام الملف
الصفحة التالية تستخدم هذا الملف:
الاستخدام العالمي للملف
الويكيات الأخرى التالية تستخدم هذا الملف:
- الاستخدام في de.wikipedia.org
- الاستخدام في en.wikipedia.org
- الاستخدام في hu.wikipedia.org
- الاستخدام في nl.wikipedia.org
- الاستخدام في www.wikidata.org