ملف:RiemannCriticalLine.svg

حجم معاينة PNG لذلك الملف ذي الامتداد SVG: 800 × 372 بكسل. الأبعاد الأخرى: 320 × 149 بكسل | 640 × 298 بكسل | 1٬024 × 476 بكسل | 1٬280 × 595 بكسل | 2٬560 × 1٬191 بكسل | 933 × 434 بكسل.
الملف الأصلي (ملف SVG، أبعاده 933 × 434 بكسل، حجم الملف: 50 كيلوبايت)
| هذا ملف من ويكيميديا كومنز. معلومات من صفحة وصفه مبينة في الأسفل. كومنز مستودع ملفات ميديا ذو رخصة حرة. |
W3C-validity not checked.
ملخص
| الوصف |
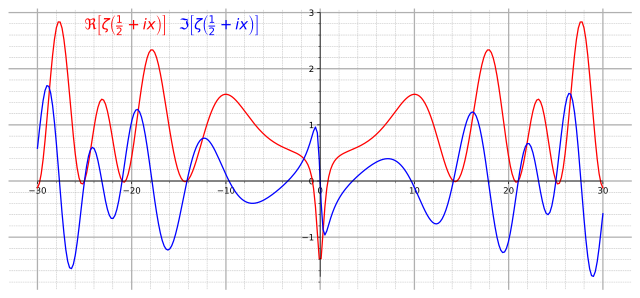
English: Graph of real (red) and imaginary (blue) parts of the critical line Re(z)=1/2 of the Riemann zeta function. |
||
| التاريخ | |||
| المصدر |
Own work. Made with Mathematica using the following code: Show[Plot[{Re[Zeta[1/2+I x]], Im[Zeta[1/2+I x]]}, {x,-30, 30},AxesLabel->{"x"} , PlotStyle->{Red, Blue}, Ticks->{Table[4x-28,{x,0,14}]}, ImageSize->{800,600}],
Graphics[Text[Style[\[DoubleStruckCapitalR][\[Zeta][ I x + "1/2"]],14,Red ,Background ->White],{-22,2.6} ]],
Graphics[Text[Style[\[GothicCapitalI][\[Zeta][ I x + "1/2"]],14,Blue ,Background ->White],{-14,2.6} ]]] |
||
| المؤلف | Slonzor | ||
| الترخيص (إعادة استخدام هذا الملف) |
Public Domain | ||
| SVG منشأ الملف | الشيفرة المصدرية لهذا الرسم المتجه صالحة. | ||
| كود مصدري | Python code
|
ترخيص
| أنا، مالِك حقوق تأليف ونشر هذا العمل، أجعله في النِّطاق العامِّ، يسري هذا في أرجاء العالم كلِّه. في بعض البلدان، قد يكون هذا التَّرخيص غيرَ مُمكنٍ قانونيَّاً، في هذه الحالة: أمنح الجميع حق استخدام هذا العمل لأي غرض دون أي شرط ما لم يفرض القانون شروطًا إضافية. |
تاريخ الملف
اضغط على زمن/تاريخ لرؤية الملف كما بدا في هذا الزمن.
| زمن/تاريخ | صورة مصغرة | الأبعاد | مستخدم | تعليق | |
|---|---|---|---|---|---|
| حالي | 20:01، 23 أغسطس 2017 | | 933 × 434 (50 كيلوبايت) | Krishnavedala | much reduced vector version |
| 22:28، 24 سبتمبر 2009 |  | 800 × 600 (122 كيلوبايت) | Geek3 | linewidth=1px | |
| 19:33، 20 نوفمبر 2008 |  | 800 × 600 (122 كيلوبايت) | Slonzor | Man i've messed this up a lot of times. | |
| 19:27، 20 نوفمبر 2008 |  | 800 × 600 (3٫36 ميجابايت) | Slonzor | ||
| 19:23، 20 نوفمبر 2008 |  | 800 × 600 (3٫36 ميجابايت) | Slonzor | ||
| 19:18، 20 نوفمبر 2008 |  | 800 × 600 (3٫36 ميجابايت) | Slonzor | ||
| 19:13، 20 نوفمبر 2008 |  | 800 × 600 (79 كيلوبايت) | Slonzor | {{Information |Description={{en|1=Graph of real (red) and imaginary (blue) parts of the critical line Re(z)=1/2 of the Riemann zeta function.}} |Source=Own work. Made with Mathematica using the following code: <code><nowiki>Show[Plot[{Re[Zeta[1/2+I x]], |
استخدام الملف
الصفحة التالية تستخدم هذا الملف:
الاستخدام العالمي للملف
الويكيات الأخرى التالية تستخدم هذا الملف:
- الاستخدام في ba.wikipedia.org
- الاستخدام في be.wikipedia.org
- الاستخدام في ca.wikipedia.org
- الاستخدام في ckb.wikipedia.org
- الاستخدام في da.wikipedia.org
- الاستخدام في el.wikipedia.org
- الاستخدام في en.wikipedia.org
- الاستخدام في eo.wikipedia.org
- الاستخدام في eu.wikipedia.org
- الاستخدام في fa.wikipedia.org
- الاستخدام في fi.wikipedia.org
- الاستخدام في he.wikipedia.org
- الاستخدام في hi.wikipedia.org
- الاستخدام في hy.wikipedia.org
- الاستخدام في id.wikipedia.org
- الاستخدام في it.wikipedia.org
- الاستخدام في it.wikiquote.org
- الاستخدام في ja.wikipedia.org
- الاستخدام في ko.wikipedia.org
- الاستخدام في la.wikipedia.org
- الاستخدام في mn.wikipedia.org
- الاستخدام في nn.wikipedia.org
- الاستخدام في no.wikipedia.org
- الاستخدام في pa.wikipedia.org
- الاستخدام في pt.wikipedia.org
- الاستخدام في ru.wikipedia.org
- الاستخدام في sl.wikipedia.org
- الاستخدام في sq.wikipedia.org
- الاستخدام في sr.wikipedia.org
- الاستخدام في uk.wikipedia.org
- الاستخدام في vi.wikipedia.org
- الاستخدام في zh-yue.wikipedia.org
- الاستخدام في zh.wikipedia.org
اعرض المزيد من الاستخدام العام لهذا الملف.