ملف:Norway Hubbert.svg

الملف الأصلي (ملف SVG، أبعاده 512 × 387 بكسل، حجم الملف: 24 كيلوبايت)
| هذا ملف من ويكيميديا كومنز. معلومات من صفحة وصفه مبينة في الأسفل. كومنز مستودع ملفات ميديا ذو رخصة حرة. |
ملخص
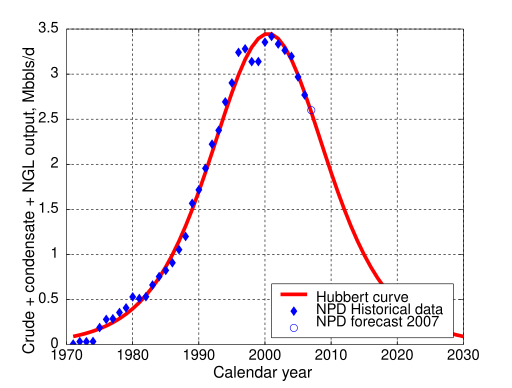
Illustration of Hubbert Theory with Norway's production.
This graphic is made under matlab and converted into SVG format using Juerg Schwizer's remarkable script [1] نسخة مؤرشفة at the Wayback Machine.
The historical production figures are from the Norwegian petroleum directory website. It is the sum of "crude oil", "Natural gas liquids" and "Condensate" columns. The Norwegians publish data using metric units (production is in million cubic meters per years) so the data is here converted into oilfield units (million barrels per day) using 1 barrel = 0.159 cubic meters. Note the 2006 is a 11-month average because december figure is not yet available.
The red curve is a direct application of Hubbert's formula, with the following values :

The model fits the historical data well. Hubbert's model works well under a set of conditions (no major production disruption, no production quotas, sufficient available capital, no limitation due to infrastructure) and Norway fulfills all of them. NPD recently published a forecast of 2.6 million barrels per day for 2007, that is well in accordance with the model.
Future production seems likely to continue its decline. Interestingly, the Hubbert curve has a future production (integration from 2007 onwards) of 9 billions barrels, almost identical to NPD's proven reserve value. However, if a new oil exploration play is found (that may happen around the Wikipedia:Lofoten Islands or the Arctic), future production will be higher, because these new resources will give a new Hubbert cycle to be added to the main one.
ترخيص

|
يسمح نسخ وتوزيع و/أو تعديل هذه الوثيقة تحت شروط رخصة جنو للوثائق الحرة، الإصدار 1.2 أو أي إصدار لاحق تنشره مؤسسة البرمجيات الحرة؛ دون أقسام ثابتة ودون نصوص أغلفة أمامية ودون نصوص أغلفة خلفية. نسخة من الرخصة تم تضمينها في القسم المسمى GNU Free Documentation License. |
| هذا الملفُّ مُرخَّص بموجب رخصة المشاع الإبداعي نسبة المُصنَّف إِلى مُؤَلِّفه - المشاركة بالمثل 3.0 العامة | ||
| ||
| تمت إضافة علامة الترخيص لهذا الملف كجزء من رخصة جنو للوثائق الحرة تحديث الترخيص. |
تاريخ الملف
اضغط على زمن/تاريخ لرؤية الملف كما بدا في هذا الزمن.
| زمن/تاريخ | صورة مصغرة | الأبعاد | مستخدم | تعليق | |
|---|---|---|---|---|---|
| حالي | 19:22، 23 يناير 2007 | | 512 × 387 (24 كيلوبايت) | Raminagrobis | Illustration of Hubbert Thérory with Norway's production. This graphic is made under matlab and converted into SVG format using Juerg Schwizer remarquable script [http://www.mathworks.com/matlabcentral/fileexchange/loadFile.do?objectId=7401&objectType= |
استخدام الملف
الصفحة التالية تستخدم هذا الملف:
الاستخدام العالمي للملف
الويكيات الأخرى التالية تستخدم هذا الملف:
- الاستخدام في en.wikipedia.org
- الاستخدام في is.wikipedia.org