ملف:Michelsonmorley-boxplot.svg

الملف الأصلي (ملف SVG، أبعاده 432 × 432 بكسل، حجم الملف: 11 كيلوبايت)
| هذا ملف من ويكيميديا كومنز. معلومات من صفحة وصفه مبينة في الأسفل. كومنز مستودع ملفات ميديا ذو رخصة حرة. |
ملخص
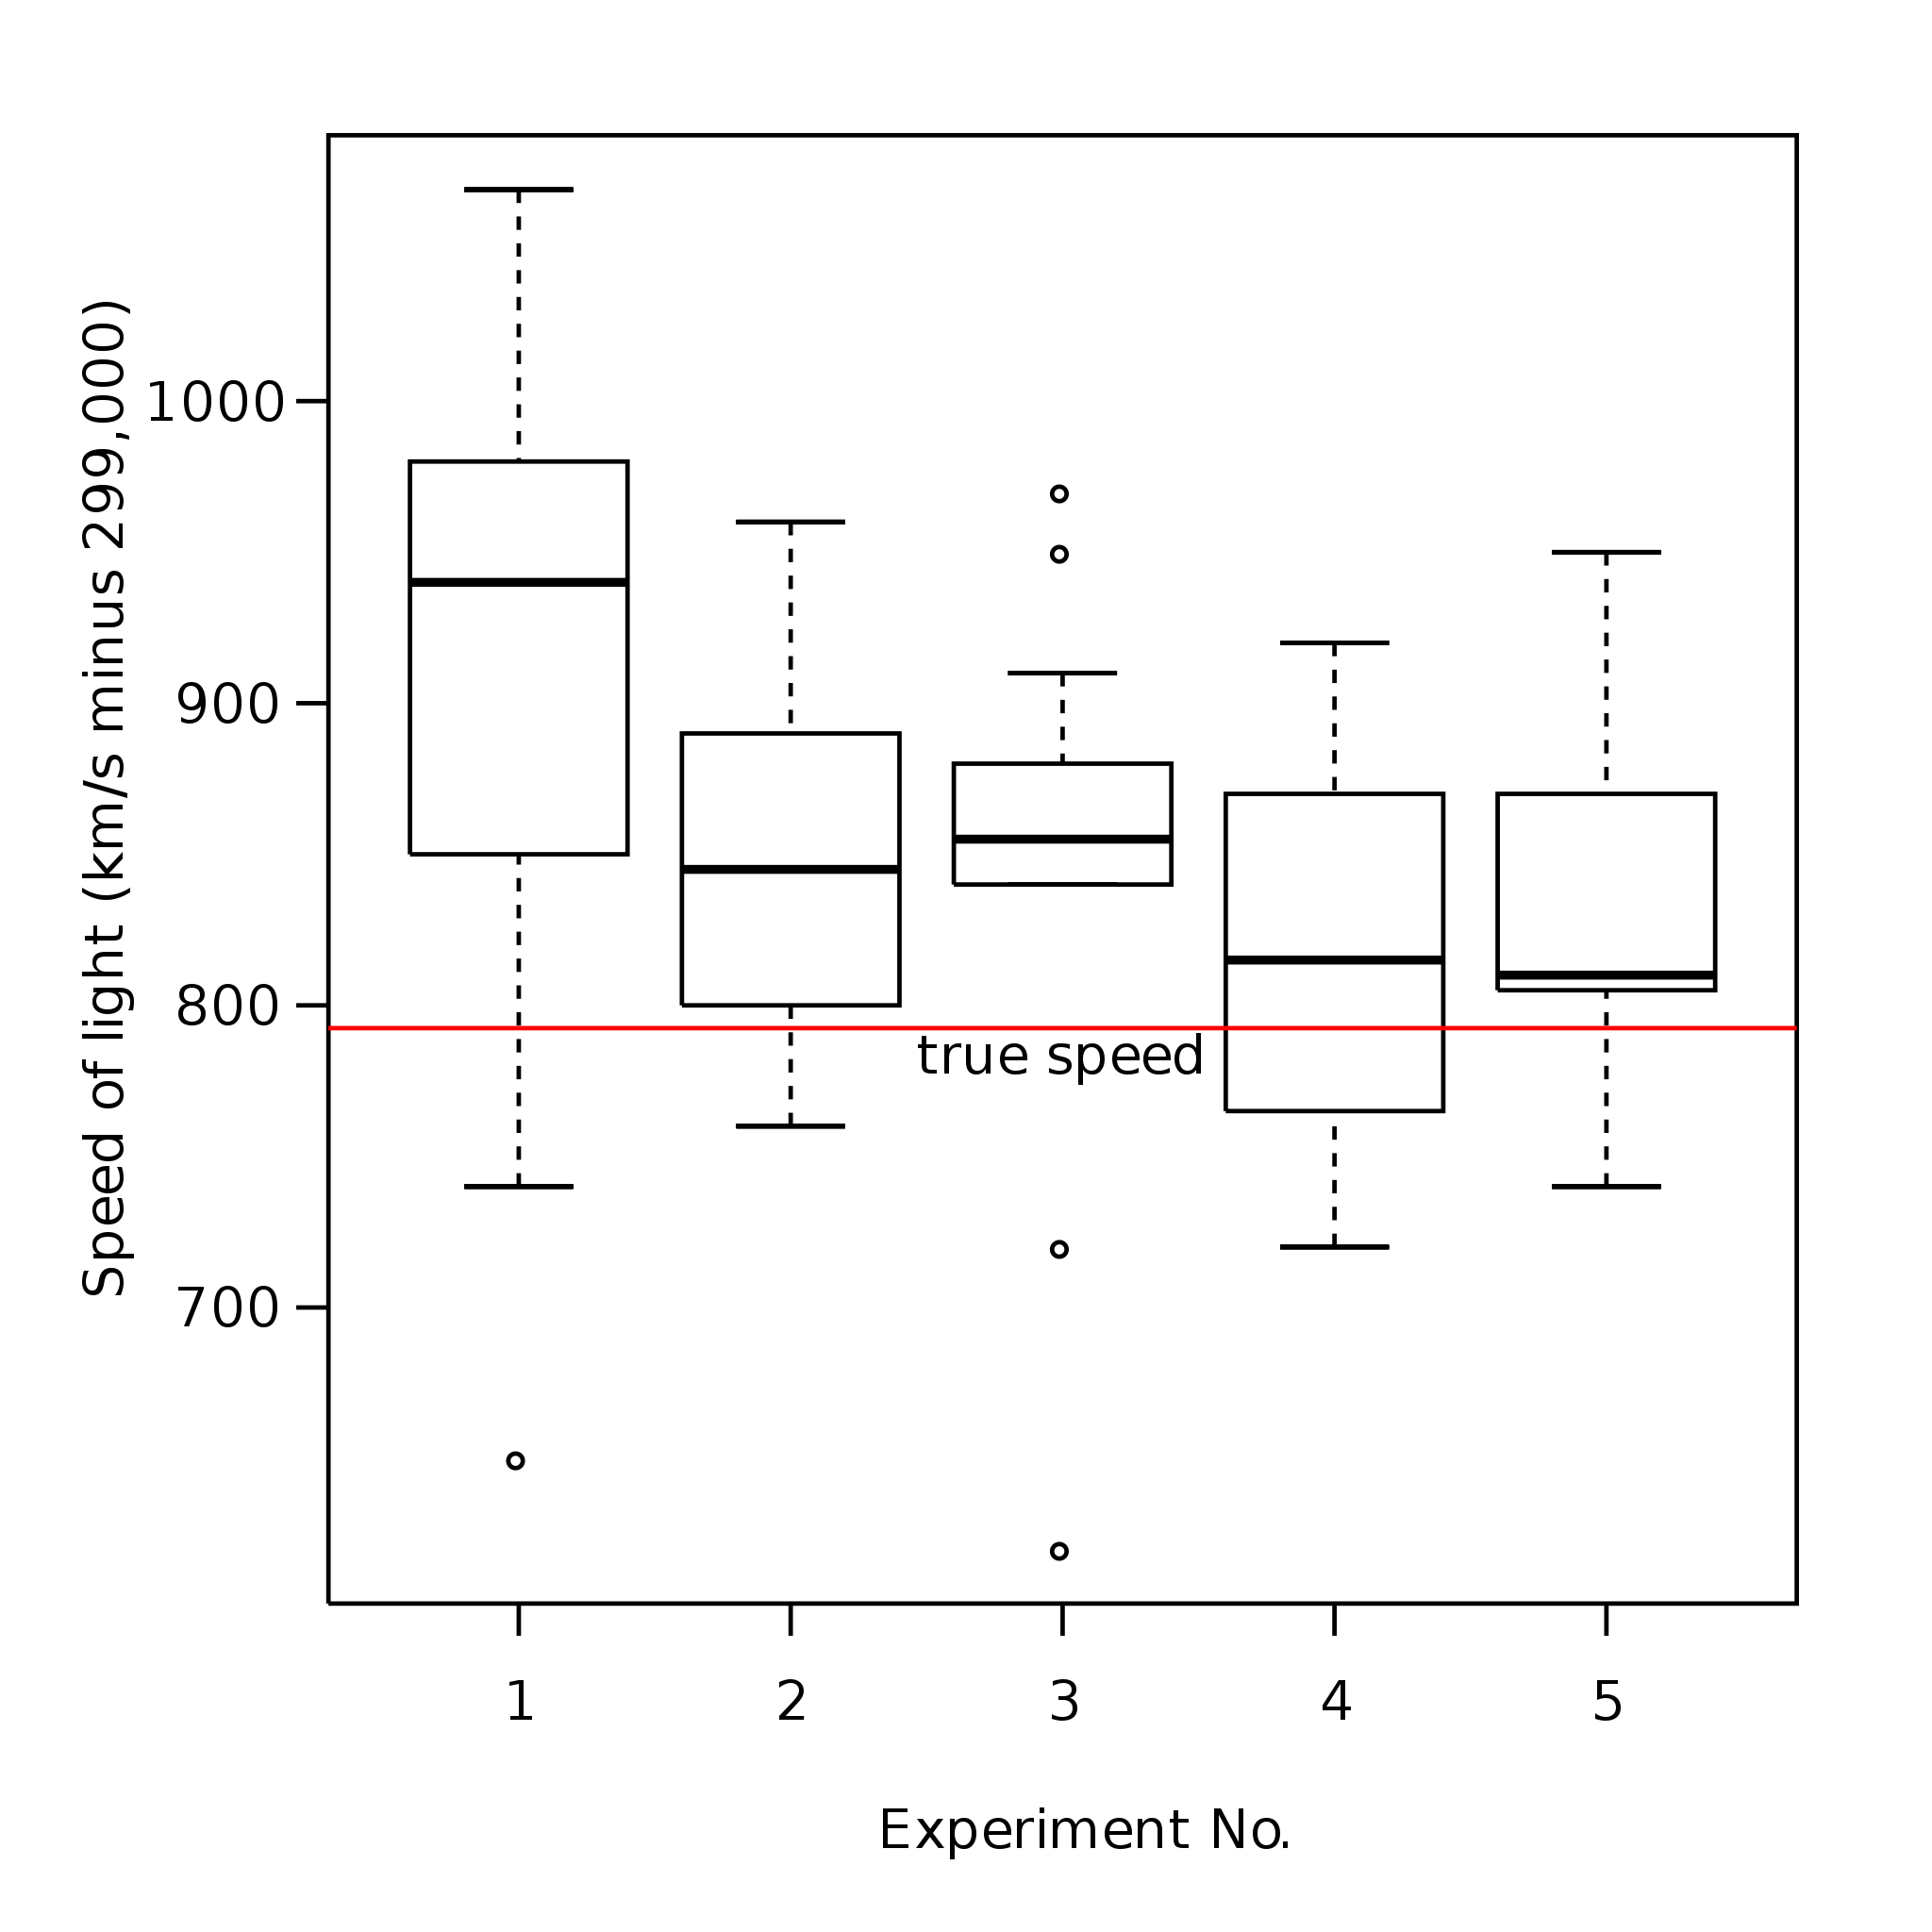
| الوصف | Boxplot representing Michelson's data on the speed of light. It consists of five experiments, each made of 20 consecutive runs. |
| التاريخ | |
| المصدر | عمل شخصي |
| المؤلف | User:Schutz |
| SVG منشأ الملف | الشيفرة المصدرية لهذا الرسم المتجه صالحة. هذا الرسم المتجهي أُنشئ بواسطة R |
This data is not from the Michelson-Morley experiment but from Michelson's measurement of the speed of light. See MICHELSON, A. A. (1882). Experimental determination of the velocity of light made at the United States Naval Academy, Annapolis. Astronomic Papers 1 pp. 109-145 U.S. Nautical Almanac Office, or S. M. Stigler (1977) Do robust estimators work with real data? Annals of Statistics 5, 1055–1098.
Original upload by User:Schutz
Boxplot representing Michelson's data on the speed of light. It consists of five experiments, each made of 20 consecutive runs. Note that the oblique line is incorrect, and probably due to a bug in the Mediawiki software/SVG converter. The graphic was created by User:Schutz for Wikipedia on 28 December 2006, using the R statistical project. The program that generated the graphic is given below; the data and the idea are from the R help page for the morley dataset (see help(morley)). The graph was exported in postscript format, converted to SVG using the pstoedit command, and the layout was slightly modified using Inkscape before upload.
  data(morley)
  morley$Expt <- factor(morley$Expt)
  morley$Run <- factor(morley$Run)
  attach(morley)

  postscript("Michelsonmorley-boxplot.ps", paper="special", height=6, width=6,
             horizontal=F)
  par(las=1)
  par(mar=c(5.1, 5.1, 2.1, 2.1))
  par(font=2)
  par(font.axis=2)
  boxplot(Speed ~ Expt, xlab = "Experiment No.", ylab="Speed of light (km/s minus 299,000)")
  abline(h=792.458, lty=3)
  dev.off()
New upload by User:Mwtoews
Boxplot representing Michelson's data on the speed of light. It consists of five experiments, each made of 20 consecutive runs.
The graphic was originally created by User:Schutz for Wikipedia on 28 December 2006, using the R statistical project. The program that generated the graphic is given below; the data and the idea are from the R help page for the morley dataset (see help(morley)). The graph was exported in PDF format, converted to SVG using Adobe Illustrator, and the layout was slightly modified using Vim before upload.
data(morley)
morley$Expt <- factor(morley$Expt)

pdf("Michelsonmorley-boxplot.pdf", height=6, width=6)
par(las=1, mar=c(5.1, 5.1, 2.1, 2.1))
boxplot(Speed ~ Expt, morley, xlab = "Experiment No.",
        ylab="Speed of light (km/s minus 299,000)")
abline(h=792.458, col="red")
text(3,792.458,"true\nspeed")
dev.off()
ترخيص
| أنا، مالِك حقوق تأليف ونشر هذا العمل، أجعله في النِّطاق العامِّ، يسري هذا في أرجاء العالم كلِّه. في بعض البلدان، قد يكون هذا التَّرخيص غيرَ مُمكنٍ قانونيَّاً، في هذه الحالة: أمنح الجميع حق استخدام هذا العمل لأي غرض دون أي شرط ما لم يفرض القانون شروطًا إضافية. |
The creator and uploader also believes that this graphic is a trivial work which does not qualify for copyright.
Reference
- A. J. Weekes (1986) A Genstat Primer. London: Edward Arnold.
تاريخ الملف
اضغط على زمن/تاريخ لرؤية الملف كما بدا في هذا الزمن.
| زمن/تاريخ | صورة مصغرة | الأبعاد | مستخدم | تعليق | |
|---|---|---|---|---|---|
| حالي | 10:25، 3 مايو 2008 | | 432 × 432 (11 كيلوبايت) | Papa November | rm opaque bg. No copyright claimed for non-creative derivative work. |
| 21:30، 30 أكتوبر 2007 |  | 432 × 432 (11 كيلوبايت) | Mwtoews | ||
| 21:27، 30 أكتوبر 2007 |  | 432 × 432 (11 كيلوبايت) | Mwtoews | ||
| 21:24، 30 أكتوبر 2007 |  | 432 × 432 (12 كيلوبايت) | Mwtoews | ||
| 18:43، 28 ديسمبر 2006 |  | 720 × 720 (19 كيلوبايت) | Schutz |
استخدام الملف
الصفحة التالية تستخدم هذا الملف:
الاستخدام العالمي للملف
الويكيات الأخرى التالية تستخدم هذا الملف:
- الاستخدام في ca.wikipedia.org
- الاستخدام في cs.wikipedia.org
- الاستخدام في cy.wikipedia.org
- الاستخدام في da.wikipedia.org
- الاستخدام في el.wiktionary.org
- الاستخدام في en.wikipedia.org
- Summary statistics
- User:Rp
- Outlier
- Box plot
- Chart
- User:Andrevan
- User:Guaka
- User:M.e
- User:Jyril
- User:Peak Freak
- User:TMA~enwiki
- User:Val42
- User:Dreish
- User:Astronouth7303
- User:FuzzyBunny
- User:Wendell
- User:Kelisi
- User:Salix alba
- User:MichaelCaricofe
- User:NeonMerlin/boxes
- User:Kazikameuk
- User:Commander Nemet
- User:Emilio floris
- User:Burwellian
- User:Physicistjedi
- User:Bayerischermann
- User:Calilasseia
- User:ChildOfTheMoon83
- User:Hibernian
- User:Jcbarr
- User:Llewdor
- User:Richfife
- User:KnowledgeLord
- Data and information visualization
- Wikipedia:Userboxes/Mathematics
- User:Blarneytherinosaur/Userboxes
- User:Whitetigah
- User:TheObtuseAngleOfDoom/Userbox
- User:Estreya
- User:Faya/Userboxes
- User:Thistheman
- User:Rachel Ayres
- User:Drummmer42
- Template:User outlier
اعرض المزيد من الاستخدام العام لهذا الملف.