ملف:High plains fresh groundwater usage 2000.svg

الملف الأصلي (ملف SVG، أبعاده 747 × 946 بكسل، حجم الملف: 1٫48 ميجابايت)
| هذا ملف من ويكيميديا كومنز. معلومات من صفحة وصفه مبينة في الأسفل. كومنز مستودع ملفات ميديا ذو رخصة حرة. |
ملخص
| الوصف |
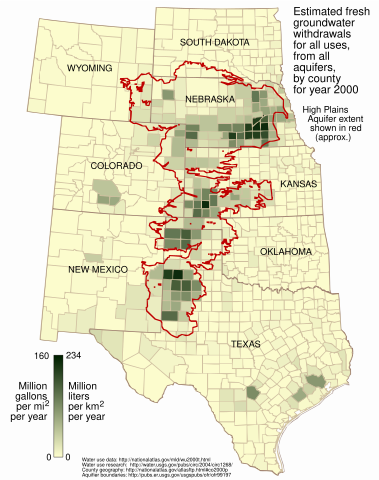
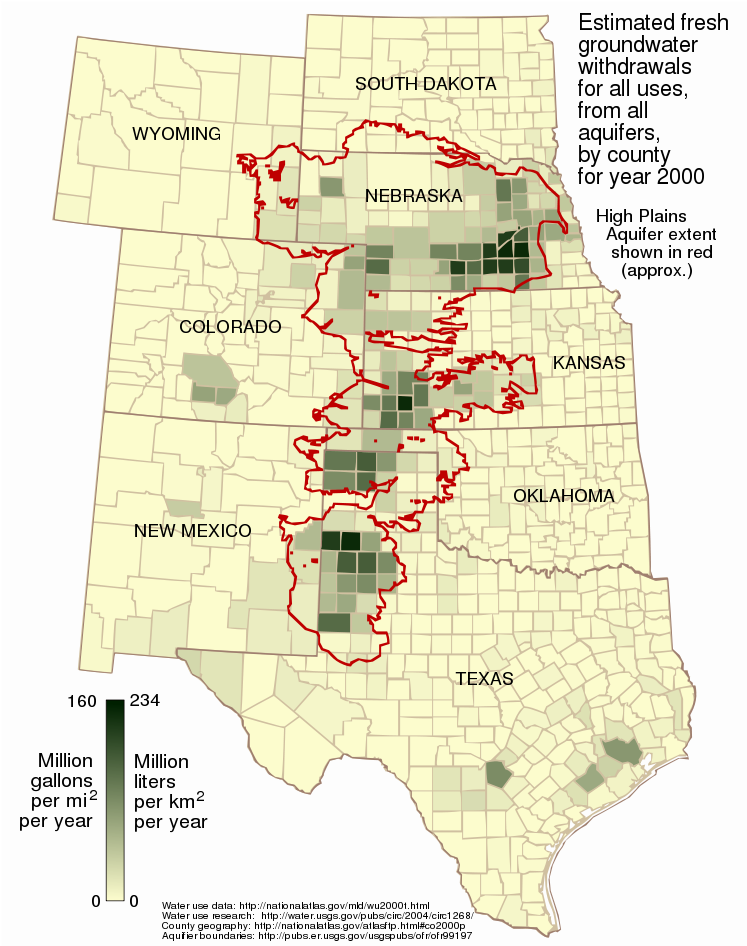
English: This map shows the estimated fresh water usage per square mile in the year 2000 for counties in the eight states underlain in part by the High Plains (Ogallala) Aquifer, presented as million gallons per square mile and million liters per square kilometer.
Usage is for all purposes -- public supply, industrial, irrigation, mining, livestock, and thermoelectric power -- from all underground sources, not just from the Ogallala Aquifer. Water usage data for the year 2000 was taken from the datafile wu2000t.dbf[1] from the US National Atlas[2]. Citation information from the metadata for that file:
Additionally:
The attribute used in this map is described:
The data is supplied as million gallons per day, by county. To arrive at an annual amount per square mile per year, the usage value from wu2000t.dbf was multiplied by 365 and divided by the number of square miles in the county as given in the 2000 county shapefile co2000p020 from the National Atlas:
Aquifer boundaries taken from Fischer and McGuire[3]. The map is presented in a Lambert azimuthal equal-area projection as used in the National Atlas (EPSG:2163[4]), the central meridian and latitude of which align nicely with the aquifer. |
| التاريخ | |
| المصدر | عمل شخصي |
| المؤلف | Kbh3rd |
| إصدارات أخرى | File:Ogallala area freshwater ground withdrawals all aquifers.png |
ترخيص
- يحقُّ لك:
- مشاركة العمل – نسخ العمل وتوزيعه وبثُّه
- إعادة إنتاج العمل – تعديل العمل
- حسب الشروط التالية:
- نسب العمل إلى مُؤَلِّفه – يلزم نسب العمل إلى مُؤَلِّفه بشكل مناسب وتوفير رابط للرخصة وتحديد ما إذا أجريت تغييرات. بالإمكان القيام بذلك بأية طريقة معقولة، ولكن ليس بأية طريقة تشير إلى أن المرخِّص يوافقك على الاستعمال.
- الإلزام بترخيص المُشتقات بالمثل – إذا أعدت إنتاج المواد أو غيرت فيها، فيلزم أن تنشر مساهماتك المُشتقَّة عن الأصل تحت ترخيص الأصل نفسه أو تحت ترخيص مُتوافِقٍ معه.
تاريخ الملف
اضغط على زمن/تاريخ لرؤية الملف كما بدا في هذا الزمن.
| زمن/تاريخ | صورة مصغرة | الأبعاد | مستخدم | تعليق | |
|---|---|---|---|---|---|
| حالي | 23:13، 9 مارس 2009 | | 747 × 946 (1٫48 ميجابايت) | Kbh3rd | corrected metric conversion - see talk |
| 01:28، 3 مارس 2009 |  | 747 × 946 (1٫48 ميجابايت) | Kbh3rd | The map said "acre" while the data, as noted on the image description page, correctly said "square mile". I have fixed that and made some minor esthetic adjustments of the state name locations. | |
| 23:40، 2 مارس 2009 |  | 747 × 946 (1٫48 ميجابايت) | Kbh3rd | {{Information |Description={{en|1=This map shows the estimated fresh water usage per square mile in the year 2000 for counties in the eight states underlain in part by the High Plains (Ogallala) Aquifer, presented as million milli |
استخدام الملف
الصفحة التالية تستخدم هذا الملف:
الاستخدام العالمي للملف
الويكيات الأخرى التالية تستخدم هذا الملف:
- الاستخدام في ca.wikipedia.org
- الاستخدام في ckb.wikipedia.org
- الاستخدام في en.wikipedia.org
- الاستخدام في fy.wikipedia.org
- الاستخدام في kk.wikipedia.org
- الاستخدام في kw.wikipedia.org
- الاستخدام في ml.wikipedia.org
- الاستخدام في pt.wikipedia.org
- الاستخدام في sr.wikipedia.org
- الاستخدام في vi.wikipedia.org
- الاستخدام في www.wikidata.org
- الاستخدام في zh.wikipedia.org