ملف:Carbon cycle-cute-diagram-fi.svg

حجم معاينة PNG لذلك الملف ذي الامتداد SVG: 540 × 417 بكسل. الأبعاد الأخرى: 311 × 240 بكسل | 622 × 480 بكسل | 995 × 768 بكسل | 1٬280 × 988 بكسل | 2٬560 × 1٬977 بكسل.
الملف الأصلي (ملف SVG، أبعاده 540 × 417 بكسل، حجم الملف: 188 كيلوبايت)
| هذا ملف من ويكيميديا كومنز. معلومات من صفحة وصفه مبينة في الأسفل. كومنز مستودع ملفات ميديا ذو رخصة حرة. |
ملخص
| الوصف |
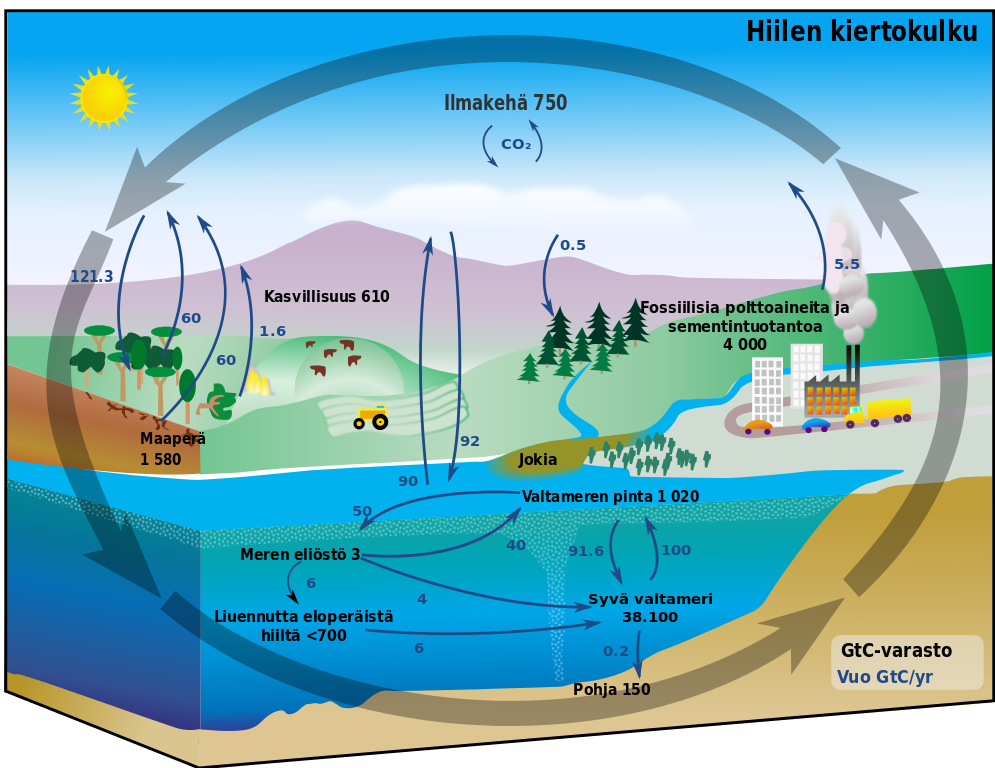
Suomi: Hiilen kiertokulku |
| التاريخ | (UTC) |
| المصدر | |
| المؤلف |
|
| إصدارات أخرى |
[] Single-language versions
|


| هذا رسمٌ مُعَدَّلٌ رقميَّاً من النسخة الأصليَّة. التعديلات هي: translated. يُمكن الاطلاع على النسخة الأصليَّة هنا: Carbon cycle-cute diagram.svg:
|
أنا، صاحب حقوق التأليف والنشر لهذا العمل، أنشر هذا العمل تحت الرخصة التالية:
| أنا، مالِك حقوق تأليف ونشر هذا العمل، أجعله في النِّطاق العامِّ، يسري هذا في أرجاء العالم كلِّه. في بعض البلدان، قد يكون هذا التَّرخيص غيرَ مُمكنٍ قانونيَّاً، في هذه الحالة: أمنح الجميع حق استخدام هذا العمل لأي غرض دون أي شرط ما لم يفرض القانون شروطًا إضافية. |
سجلُّ الرَّفع الأصيل
This image is a derivative work of the following images:
- File:Carbon_cycle-cute_diagram.svg licensed with PD-self
- 2010-06-01T07:08:20Z Dub4u 540x417 (190516 Bytes) Reverted to version as of 03:49, 1 June 2010
- 2010-06-01T06:35:43Z Dub4u 540x417 (169030 Bytes) Again, trying to get around librsvg-ERROR
- 2010-06-01T03:49:58Z Dub4u 540x417 (190516 Bytes) Reverted to version as of 21:24, 16 July 2009
- 2010-06-01T00:29:45Z Dub4u 540x417 (174775 Bytes) "Stroke to Path", still trying to fix librsvg-ERROR
- 2010-06-01T00:20:04Z Dub4u 540x417 (155553 Bytes) SVG saved as "Plain SVG" in Inkscape to fix librsvg-ERROR of previous version
- 2010-06-01T00:07:05Z Dub4u 540x417 (162368 Bytes) Added flow totals between terrestrial and atmosphere.
- 2009-07-16T21:24:05Z Jarl Arntzen 540x417 (190516 Bytes) 1. Corrected direction of 90Gt arrow, now going up from the ocean, not down into it. 2. Enlarged arrow head of all arrows to make the direction clearer. 3. Made all text for fluxes in blue instead of indigo to make it more di
- 2008-06-01T02:20:22Z FischX 540x417 (154403 Bytes) {{Information |Description= |Source= |Date= |Author= |Permission= |other_versions= }}
- 2008-05-30T02:17:27Z FischX 540x417 (125503 Bytes) {{Information |Description= |Source= |Date= |Author= |Permission= |other_versions= }}
- 2008-05-30T02:03:21Z FischX 540x417 (126458 Bytes) {{Information |Description={{en|This [[:en:carbon cycle|carbon cycle]] diagram shows the storage and annual exchange of carbon between the [[:en:Earth's atmosphere|atmosphere]], [[:en:hydrosphere|hydrosphere]] and [[:en:geosp
Uploaded with derivativeFX
تاريخ الملف
اضغط على زمن/تاريخ لرؤية الملف كما بدا في هذا الزمن.
| زمن/تاريخ | صورة مصغرة | الأبعاد | مستخدم | تعليق | |
|---|---|---|---|---|---|
| حالي | 12:21، 15 سبتمبر 2010 | | 540 × 417 (188 كيلوبايت) | Olli | fix |
| 06:07، 15 سبتمبر 2010 |  | 540 × 417 (186 كيلوبايت) | Olli | {{Information |Description={{fi|Hiilen kiertokulku}} |Source=*File:Carbon_cycle-cute_diagram.svg |Date=2010-09-15 06:06 (UTC) |Author=*File:Carbon_cycle-cute_diagram.svg: * [[:File:Carbon_cycle-cute_diagram.jpeg|Carbon_cycle-cute_diagram.jpeg] |
استخدام الملف
لا توجد صفحات تستخدم هذا الملف.