ملف:Australian radiogenic granite and sedimentary basin geothermal hot rock potential map - GA10333.pdf

حجم معاينة JPG لذلك الملف ذي الامتداد PDF: 800 × 566 بكسل. الأبعاد الأخرى: 320 × 226 بكسل | 640 × 453 بكسل | 1٬024 × 725 بكسل | 1٬280 × 906 بكسل | 2٬560 × 1٬811 بكسل | 7٬018 × 4٬966 بكسل.
الملف الأصلي (7٬018 × 4٬966 بكسل حجم الملف: 9٫27 ميجابايت، نوع MIME: application/pdf)
| هذا ملف من ويكيميديا كومنز. معلومات من صفحة وصفه مبينة في الأسفل. كومنز مستودع ملفات ميديا ذو رخصة حرة. |
ملخص
| الوصف |
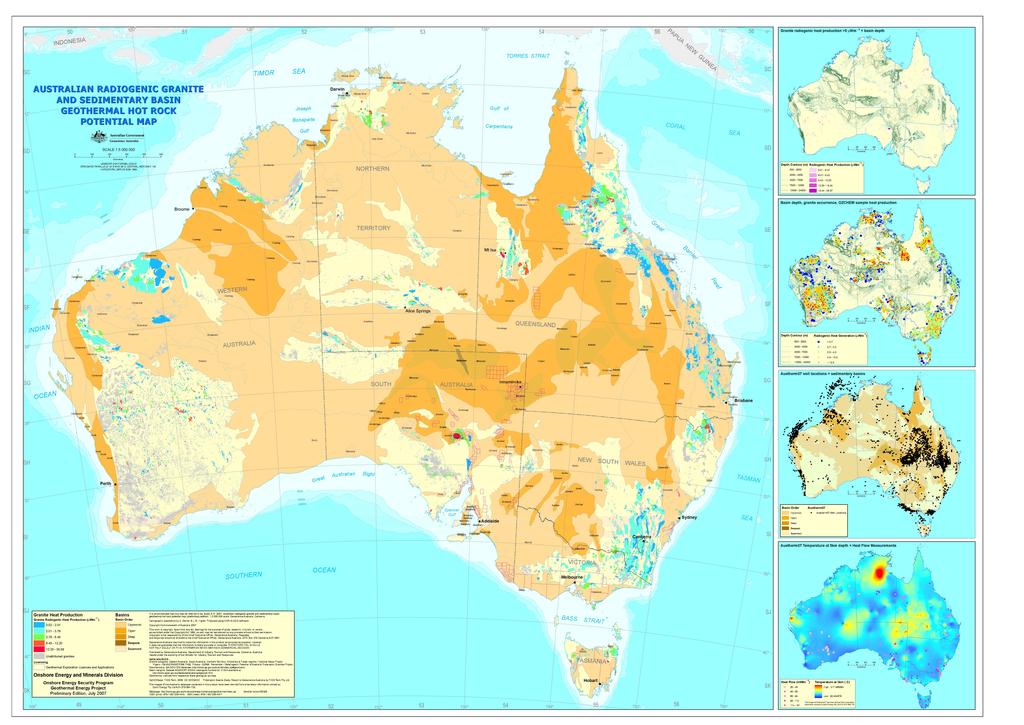
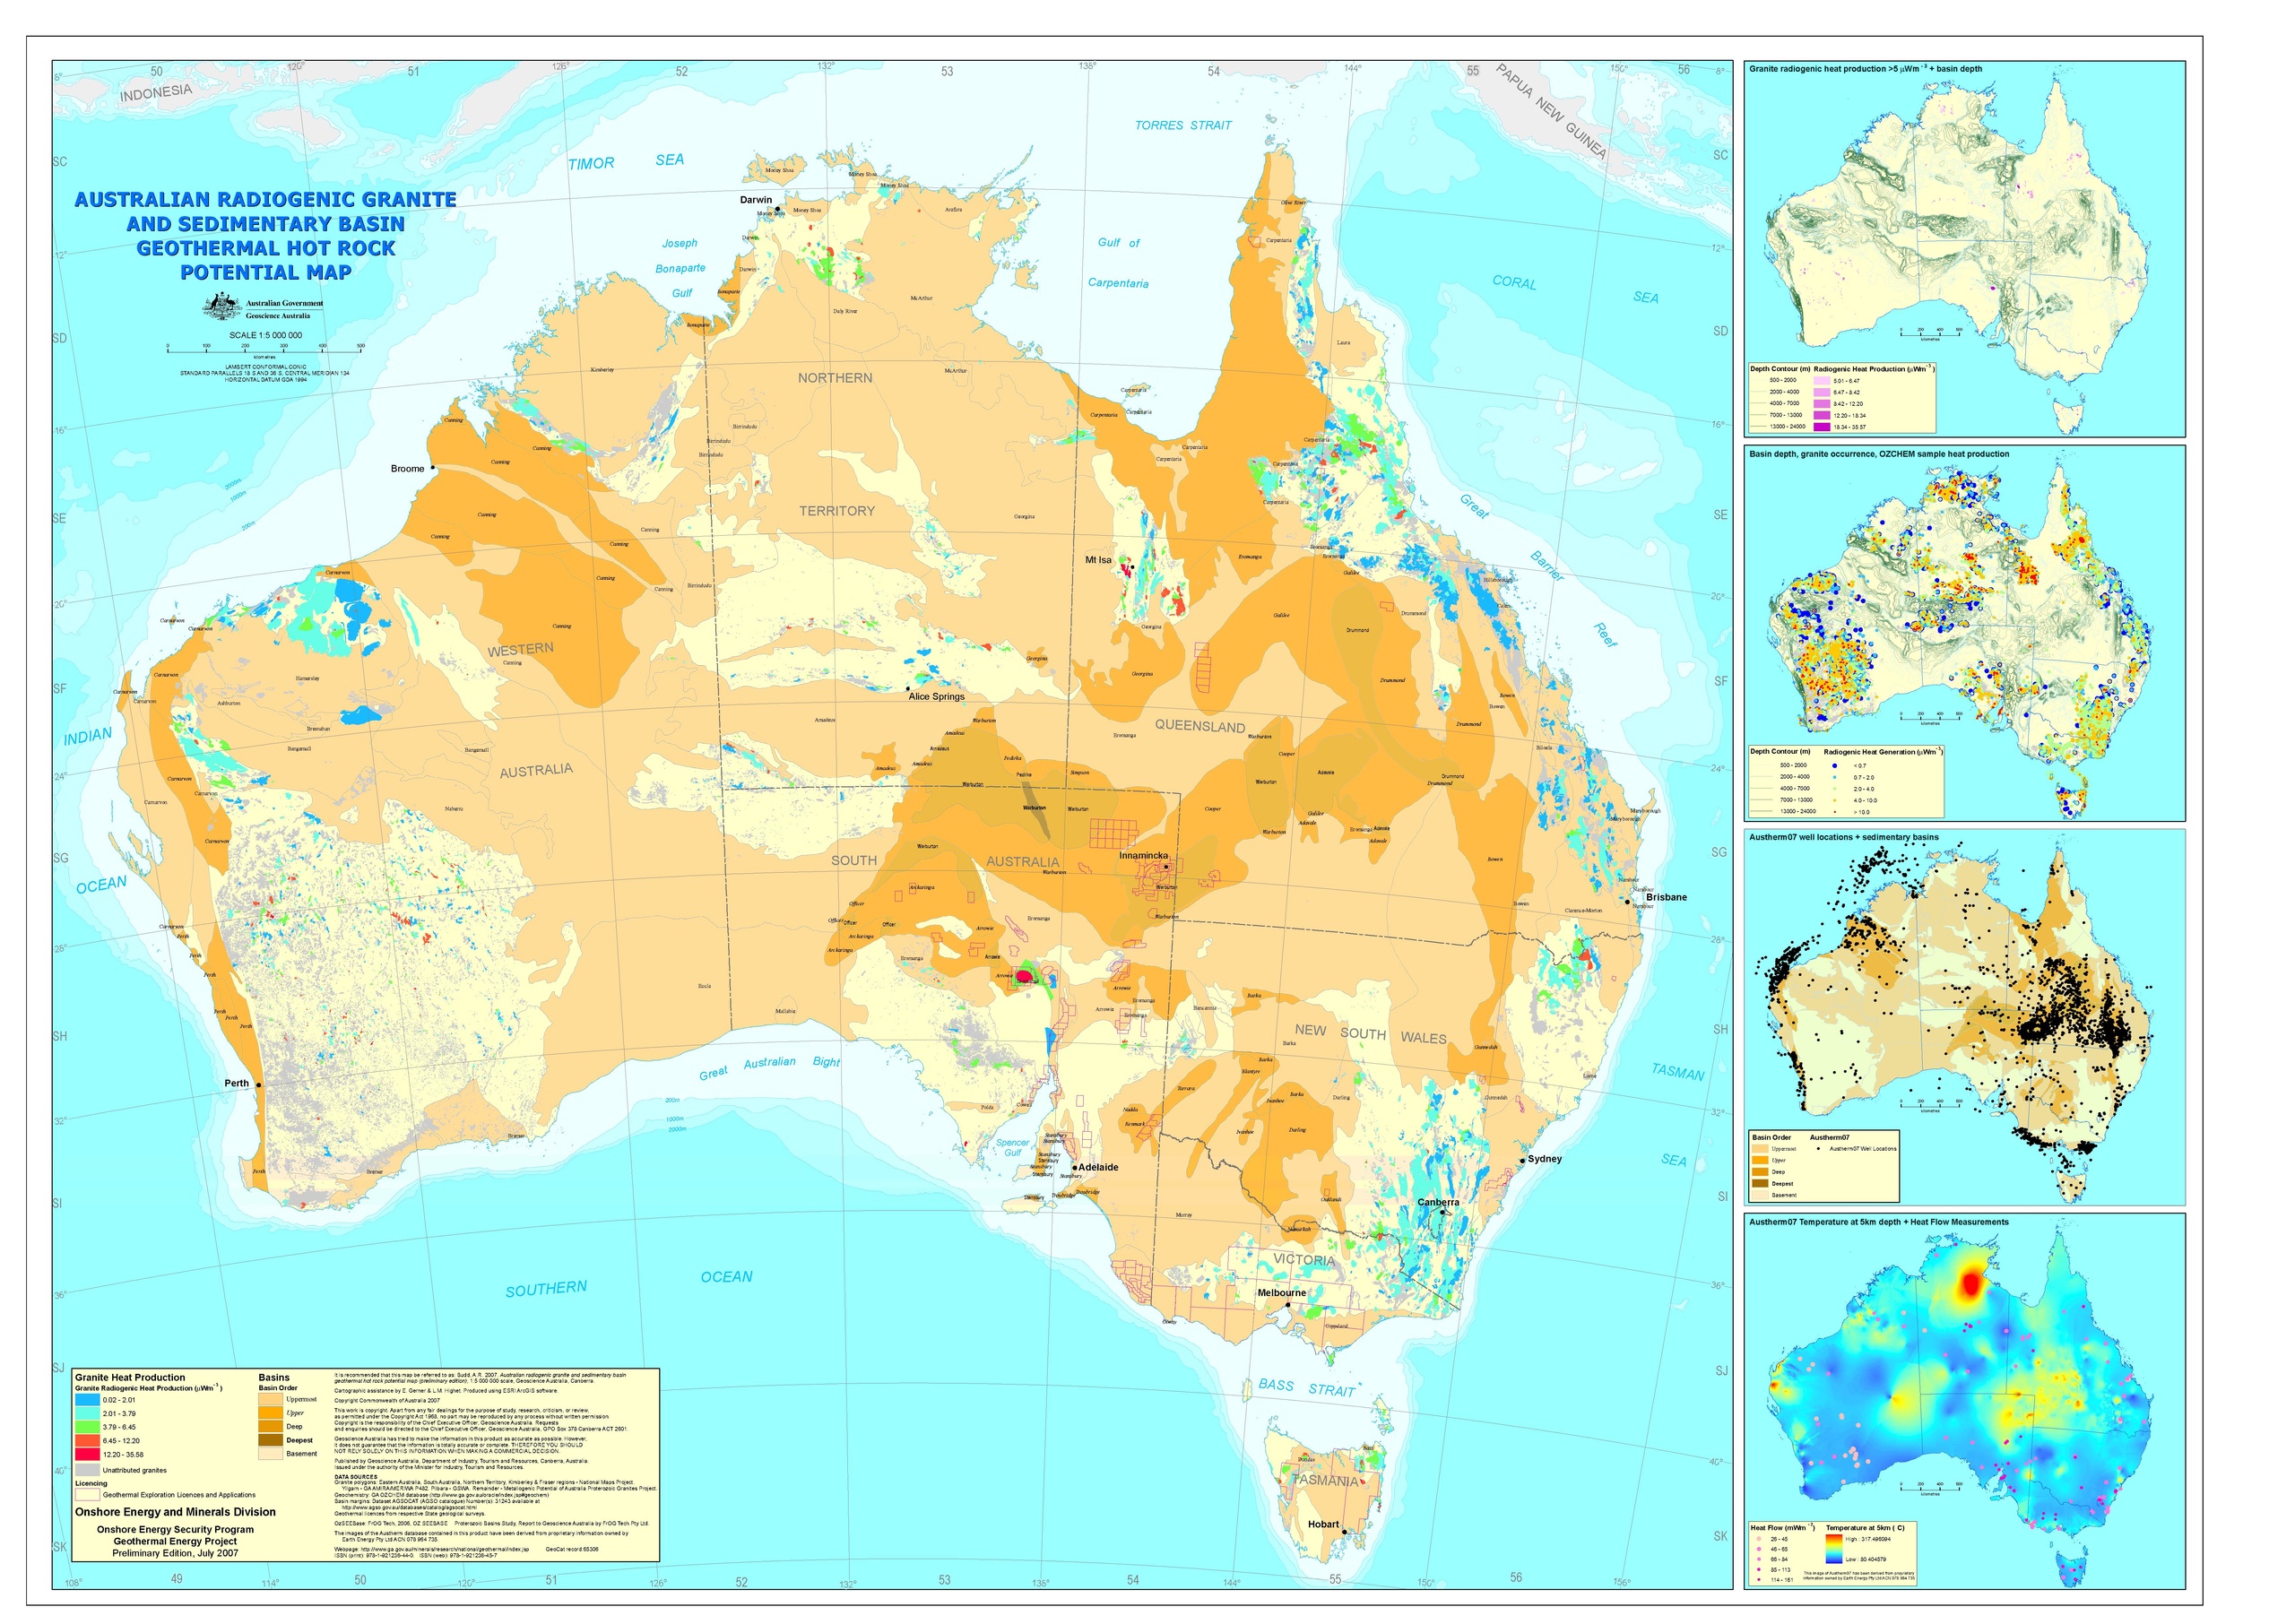
English: Australian radiogenic granite and sedimentary basin geothermal hot rock potential map. The hot rock geothermal model in the Australian context comprises high-heat producing granites overlain by thick accumulations of low-thermal conductivity sediments. The granites have low concentrations of radiogenic elements, and over hundreds of millions of years, these elements decay and produce heat. The passage of this heat to the Earth's surface via upwards conduction is slowed by layers of sediments that have low thermal conductivity, creating 'hot spots' beneath the blankets. This thematic map shows granites attributed by heat production and basin depth. The majority of the granites depicted are of surface outcrop. The presence of high-heat producing granites adjacent to deep sedimentary basins may be used as a first-order indicator of where to further investigate the possibility of hot rock geothermal plays.
The main frame of the map shows all granites (attributed by calculated heat production - where available), sedimentary basins (and their order e.g. where one basin is overlapped by another) and geothermal licences and applications. The top right inset map shows only those granites with a calculated radiogenic heat generation of >5 uW -3, with the depth of the sedimentary basins. This map provides a rapid view of areas that may be expected to have the greatest hot rock potential. The second-from-top inset map shows all suitable geochemical analyses from OZCHEM, attributed by calculated radiogenic heat generation. This shows both the distribution of data that goes into attributing the granite polygons, and also analyses of granites (and other rocks) that fall outside the mapped granite polygons that are otherwise excluded from the main map. The third-from-top inset map shows the distribution of drillholes with temperature measurements. The bottom inset map shows an image of the Austherm07 database, which is derived from the drillhole temperature information. The image shows the projected temperature of the crust at a depth of 5 kilometres, interpolated between the drillholes. Overlain on this image is the small number of publicly-available heat flow data. |
| التاريخ | |
| المصدر | https://www.ga.gov.au/products/servlet/controller?event=GEOCAT_DETAILS&catno=65306 (Direct) |
| المؤلف | Geoscience Australia (senior author Budd, A.R.) |
ترخيص
هذا الملف مُرخص تحت رخصة المشاع المبدع نسبة المصنف إلى مؤلفه 3.0 استراليا
نسب العمل لمُؤَلِّفه: Geoscience Australia
- يحقُّ لك:
- مشاركة العمل – نسخ العمل وتوزيعه وبثُّه
- إعادة إنتاج العمل – تعديل العمل
- حسب الشروط التالية:
- نسب العمل إلى مُؤَلِّفه – يلزم نسب العمل إلى مُؤَلِّفه بشكل مناسب وتوفير رابط للرخصة وتحديد ما إذا أجريت تغييرات. بالإمكان القيام بذلك بأية طريقة معقولة، ولكن ليس بأية طريقة تشير إلى أن المرخِّص يوافقك على الاستعمال.

رُوجِع هذا الملفُّ الذي نشر أوَّلاً في الموقع ga.gov.au، بتاريخ 15 October 2013 من قبل المُراجِع Bobamnertiopsis الذي أكَّد
أنَّه كان مُتوافِراً في ذلك المَوقع في ذلك التاريخ تحت الرُّخصة المُشار إِليها.
|
تاريخ الملف
اضغط على زمن/تاريخ لرؤية الملف كما بدا في هذا الزمن.
| زمن/تاريخ | صورة مصغرة | الأبعاد | مستخدم | تعليق | |
|---|---|---|---|---|---|
| حالي | 07:28، 12 سبتمبر 2013 |  | 7٬018 × 4٬966 (9٫27 ميجابايت) | 99of9 | User created page with UploadWizard |
استخدام الملف
الصفحة التالية تستخدم هذا الملف:
الاستخدام العالمي للملف
الويكيات الأخرى التالية تستخدم هذا الملف:
- الاستخدام في en.wikipedia.org