ملف:Angular map of fusors around Sol within 12ly (large).png
الملف الأصلي (855 × 870 بكسل حجم الملف: 85 كيلوبايت، نوع MIME: image/png)
| هذا ملف من ويكيميديا كومنز. معلومات من صفحة وصفه مبينة في الأسفل. كومنز مستودع ملفات ميديا ذو رخصة حرة. |
ملخص
| الوصف |
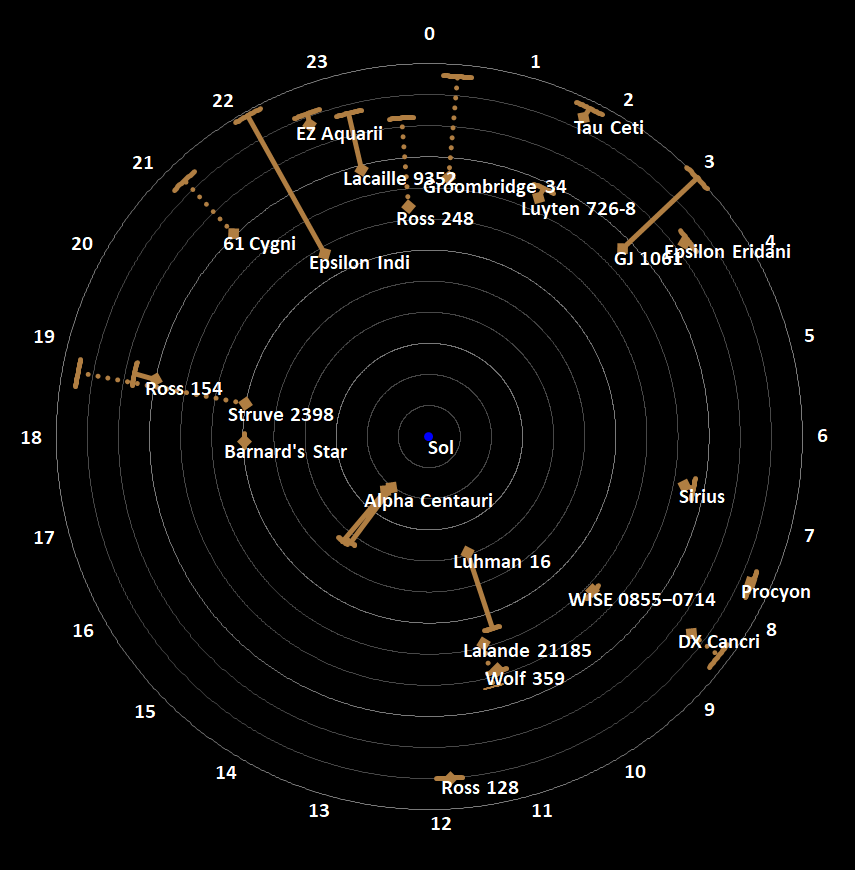
English: This is a stellar map, employing an original map concept, which combines graphically the distance of all stellar systems or singular fusors (stars and brown dwarfs) and sub-brown dwarfs within 12 light-years (ly) or 3.7 parsecs from Earth, along with their angular location as viewed from Earth. The result provides a readable and correct depiction of the distance from the center (Earth/Sol) and location in three dimensional space of the described stellar objects, allowing a correct depiction of proximity among the depicted stellar objects.
How to read: This map is a common radar screen type of map displaying stellar objects around Sol. Each stellar object is marked jointly by two points, a diamond marked point and an line marked point, as well as an either unbroken or dotted straight line which connects the two points.
The circular lines indicate the distance from the map-center by being set apart in one light-year steps. At the outermost circular line the hours angle for the right ascension is displayed clockwise. The circular lines therefore represent the hour-axis and, through their repetition in one light-year steps, the distance-axis.
Straight lines: The straight lines (unbroken or dotted) represent the arcs of the declination angles (see also circular sector of a unit circle) of the stellar objects on their hour circle toward the celestial poles (with the poles being congruent with the center of the map). Since the map is viewed top-down from the south, allowing a clockwise eastward-reading (opposed to when using sidereal hour angles), the dotted straight lines are arcs with positive declination, down from the reference plane/level, toward the star Polaris, the northern celestial pole (which would be allmost congruent with the center of the map, if it would display stars further than 12 ly). That said the straight lines also represent a top-down view of the hypotenuse between the points of a right-angled triangle with its right-angle on the plane/level; but the straight lines, when viewed true to length, represent the base x-line of the described triangle. Calculation of the length of the displayed straight lines is: x = "distance of the stellar objects to the map-center in ly" - ("distance of the stellar objects to the map-center in ly" * sin(180°-90°-"declination"))  Note: Proxima Centauri is the only marked stellar object not labled and not being an independent stellar object or the primary body of a stellar system (which in its case is Alpha Centauri), but still being noteworthy since it is the closest fusor to Sol. Epoch J2000.0, see List of nearest stars and brown dwarfs. Produced with Microsoft Excel (radar chart) |
| التاريخ | |
| المصدر | عمل شخصي |
| المؤلف | Nsae Comp |
| إصدارات أخرى |
|

.png)

.png)
ترخيص
- يحقُّ لك:
- مشاركة العمل – نسخ العمل وتوزيعه وبثُّه
- إعادة إنتاج العمل – تعديل العمل
- حسب الشروط التالية:
- نسب العمل إلى مُؤَلِّفه – يلزم نسب العمل إلى مُؤَلِّفه بشكل مناسب وتوفير رابط للرخصة وتحديد ما إذا أجريت تغييرات. بالإمكان القيام بذلك بأية طريقة معقولة، ولكن ليس بأية طريقة تشير إلى أن المرخِّص يوافقك على الاستعمال.
- الإلزام بترخيص المُشتقات بالمثل – إذا أعدت إنتاج المواد أو غيرت فيها، فيلزم أن تنشر مساهماتك المُشتقَّة عن الأصل تحت ترخيص الأصل نفسه أو تحت ترخيص مُتوافِقٍ معه.
تاريخ الملف
اضغط على زمن/تاريخ لرؤية الملف كما بدا في هذا الزمن.
| زمن/تاريخ | صورة مصغرة | الأبعاد | مستخدم | تعليق | |
|---|---|---|---|---|---|
| حالي | 07:18، 6 مارس 2023 | | 855 × 870 (85 كيلوبايت) | Nsae Comp | Uploaded own work with UploadWizard |
استخدام الملف
الصفحة التالية تستخدم هذا الملف:
الاستخدام العالمي للملف
الويكيات الأخرى التالية تستخدم هذا الملف:
- الاستخدام في bs.wikipedia.org
- الاستخدام في de.wikipedia.org
- الاستخدام في el.wikipedia.org
- الاستخدام في en.wikipedia.org
- الاستخدام في pt.wikipedia.org
.png)