ملف:2006chemical tanker fleet.PNG
حجم هذه المعاينة: 800 × 351 بكسل. الأبعاد الأخرى: 320 × 140 بكسل | 640 × 281 بكسل | 1٬425 × 625 بكسل.
الملف الأصلي (1٬425 × 625 بكسل حجم الملف: 59 كيلوبايت، نوع MIME: image/png)
| هذا ملف من ويكيميديا كومنز. معلومات من صفحة وصفه مبينة في الأسفل. كومنز مستودع ملفات ميديا ذو رخصة حرة. |
ملخص
| الوصف |
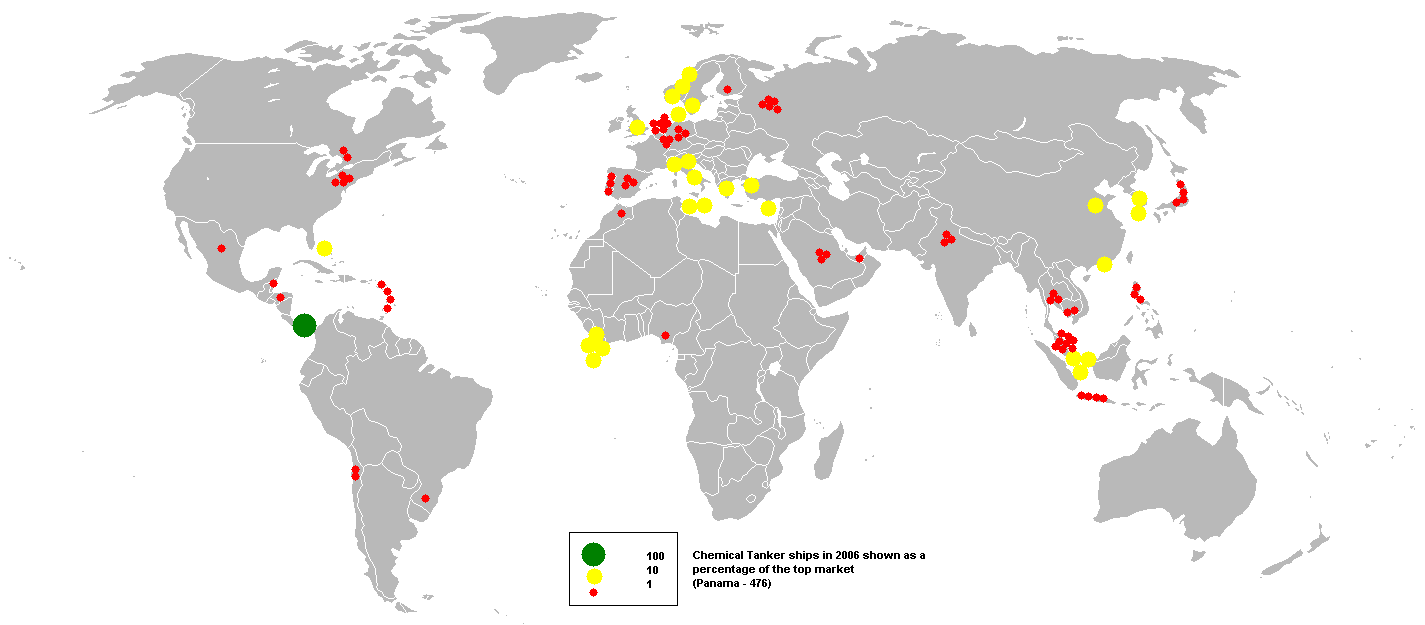
English: This bubble map shows the global distribution of chemical tanker ships in 2006 as a percentage of the top market (Panama - 476).
This map is consistent with incomplete set of data too as long as the top producer is known. It resolves the accessibility issues faced by colour-coded maps that may not be properly rendered in old computer screens. Data was extracted on 30th September 2007 from https://www.cia.gov/library/publications/the-world-factbook/fields/2108.html Based on Image:BlankMap-World.png |
| التاريخ | ٣٠ سبتمبر ٢٠٠٧ (تاريخ الرفع الأصيل) |
| المصدر | نُقِلت من en.wikipedia إلى كُومُنز بواسطة Tam0031 باستخدام CommonsHelper. |
| المؤلف | Anwar saadat في ويكيبيديا الإنجليزية |
ترخيص
| وضع -Anwar saadat في ويكيبيديا الإنجليزية-، وهو المؤلف، هذا العمل في النِّطاق العامِّ. يسري ذلك في كل أرجاء العالم. في بعض البلدان، قد يكون هذا التَّرخيص غيرَ مُمكنٍ قانونيَّاً، في هذه الحالة: يمنح Anwar saadat الجميع حق استخدام هذا العمل لأي غرض دون أي شرط ما لم يفرض القانون شروطًا إضافية. |
سجلُّ الرَّفع الأصيل
صفحة الوصف الأصلية كانت هنا، تشير جميع أسماء المستخدمين التالية إلى en.wikipedia.
- 2007-09-30 08:36 Anwar saadat 1425×625× (60698 bytes) This bubble map shows the global distribution of chemical tanker ships in 2006 as a percentage of the top market (Panama - 476). This map is consistent with incomplete set of data too as long as the top producer is known. It resolves the accessibility is
تاريخ الملف
اضغط على زمن/تاريخ لرؤية الملف كما بدا في هذا الزمن.
| زمن/تاريخ | صورة مصغرة | الأبعاد | مستخدم | تعليق | |
|---|---|---|---|---|---|
| حالي | 16:16، 2 فبراير 2009 | | 1٬425 × 625 (59 كيلوبايت) | File Upload Bot (Magnus Manske) | {{BotMoveToCommons|en.wikipedia}} {{Information |Description={{en|This bubble map shows the global distribution of chemical tanker ships in 2006 as a percentage of the top market (Panama - 476). This map is co |
استخدام الملف
الصفحة التالية تستخدم هذا الملف:
الاستخدام العالمي للملف
الويكيات الأخرى التالية تستخدم هذا الملف:
- الاستخدام في ja.wikipedia.org
- الاستخدام في lt.wikipedia.org