ملف:Social Security Worker to Beneficiary Ratio.png
حجم هذه المعاينة: 800 × 600 بكسل. الأبعاد الأخرى: 320 × 240 بكسل | 640 × 480 بكسل | 960 × 720 بكسل.
الملف الأصلي (960 × 720 بكسل حجم الملف: 10 كيلوبايت، نوع MIME: image/png)
| هذا ملف من ويكيميديا كومنز. معلومات من صفحة وصفه مبينة في الأسفل. كومنز مستودع ملفات ميديا ذو رخصة حرة. |
ملخص
| الوصف |
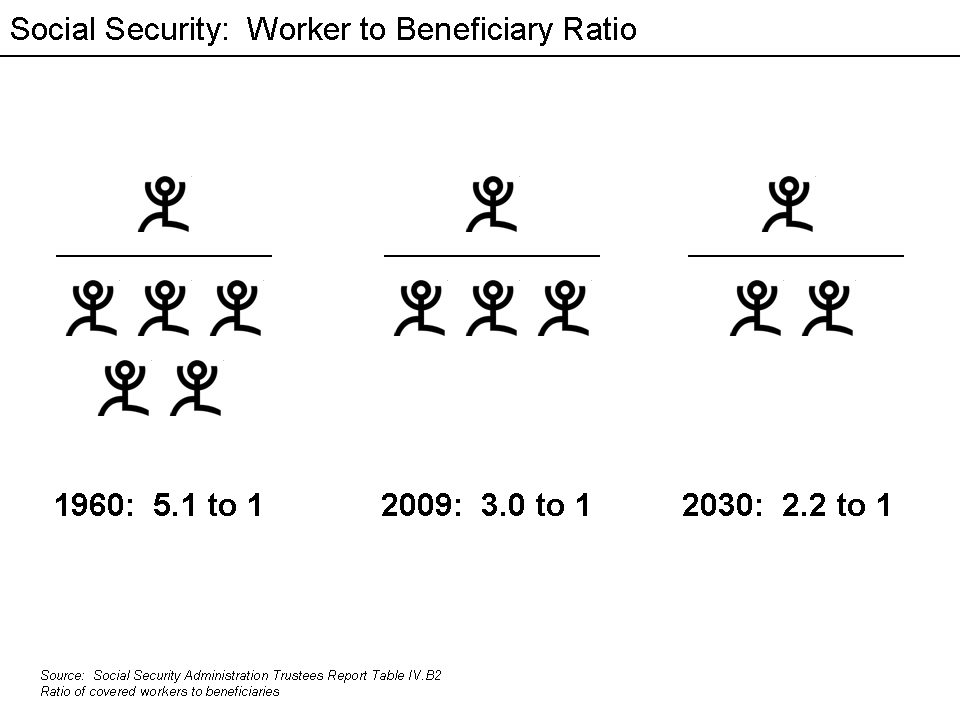
English: Social Security - Ratio of workers to beneficiaries Explanation |
| التاريخ | (UTC) |
| المصدر | I (Farcaster (talk)) created this work entirely by myself. |
| المؤلف | Farcaster (talk) 01:52, 6 May 2011 (UTC) |

|
هذه graph الصورة / الصورتان باستعمال رسومات متجهية ملفات رسوميات شعاعية.
It is recommended to name the SVG file "Social Security Worker to Beneficiary Ratio.svg" - then the template Vector version available (or Vva) does not need the new image name parameter.
|
ترخيص
Farcaster في ويكيبيديا الإنجليزية، صاحب حقوق تأليف ونشر هذا العمل، ينشره تحت الرَّخص التالية:
هذا الملفُّ مُرخَّص بموجب رخصة المشاع الإبداعي نسبة المُصنَّف إِلى مُؤَلِّفه - المشاركة بالمثل 3.0 العامة
نسب العمل لمُؤَلِّفه: Farcaster في ويكيبيديا الإنجليزية
- يحقُّ لك:
- مشاركة العمل – نسخ العمل وتوزيعه وبثُّه
- إعادة إنتاج العمل – تعديل العمل
- حسب الشروط التالية:
- نسب العمل إلى مُؤَلِّفه – يلزم نسب العمل إلى مُؤَلِّفه بشكل مناسب وتوفير رابط للرخصة وتحديد ما إذا أجريت تغييرات. بالإمكان القيام بذلك بأية طريقة معقولة، ولكن ليس بأية طريقة تشير إلى أن المرخِّص يوافقك على الاستعمال.
- الإلزام بترخيص المُشتقات بالمثل – إذا أعدت إنتاج المواد أو غيرت فيها، فيلزم أن تنشر مساهماتك المُشتقَّة عن الأصل تحت ترخيص الأصل نفسه أو تحت ترخيص مُتوافِقٍ معه.

|
يسمح نسخ وتوزيع و/أو تعديل هذه الوثيقة تحت شروط رخصة جنو للوثائق الحرة، الإصدار 1.2 أو أي إصدار لاحق تنشره مؤسسة البرمجيات الحرة؛ دون أقسام ثابتة ودون نصوص أغلفة أمامية ودون نصوص أغلفة خلفية. نسخة من الرخصة تم تضمينها في القسم المسمى GNU Free Documentation License. |
لك أن تختار الرخصة التي تناسبك.
سجلُّ الرَّفع الأصيل
صفحة الوصف الأصلية كانت هنا، تشير جميع أسماء المستخدمين التالية إلى en.wikipedia.
| زمن/تاريخ | الأبعاد | مستخدم | تعليق |
|---|---|---|---|
| 2011-05-06 01:52 | 960×720× (10209 bytes) | Farcaster | {{Information |Description = Social Security - Ratio of workers to beneficiaries |Source = I (~~~) created this work entirely by myself. |Date = ~~~~~ |Author = ~~~~ |other_versions = }} |
تاريخ الملف
اضغط على زمن/تاريخ لرؤية الملف كما بدا في هذا الزمن.
| زمن/تاريخ | صورة مصغرة | الأبعاد | مستخدم | تعليق | |
|---|---|---|---|---|---|
| حالي | 23:23، 29 مارس 2016 | | 960 × 720 (10 كيلوبايت) | FastilyClone | Transferred from enwp |
استخدام الملف
الصفحة التالية تستخدم هذا الملف:
الاستخدام العالمي للملف
الويكيات الأخرى التالية تستخدم هذا الملف:
- الاستخدام في en.wikipedia.org
- الاستخدام في fi.wikipedia.org
- الاستخدام في ja.wikipedia.org