ملف:Population curve.svg

حجم معاينة PNG لذلك الملف ذي الامتداد SVG: 547 × 332 بكسل. الأبعاد الأخرى: 320 × 194 بكسل | 640 × 388 بكسل | 1٬024 × 622 بكسل | 1٬280 × 777 بكسل | 2٬560 × 1٬554 بكسل.
الملف الأصلي (ملف SVG، أبعاده 547 × 332 بكسل، حجم الملف: 10 كيلوبايت)
| هذا ملف من ويكيميديا كومنز. معلومات من صفحة وصفه مبينة في الأسفل. كومنز مستودع ملفات ميديا ذو رخصة حرة. |
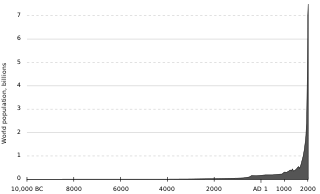
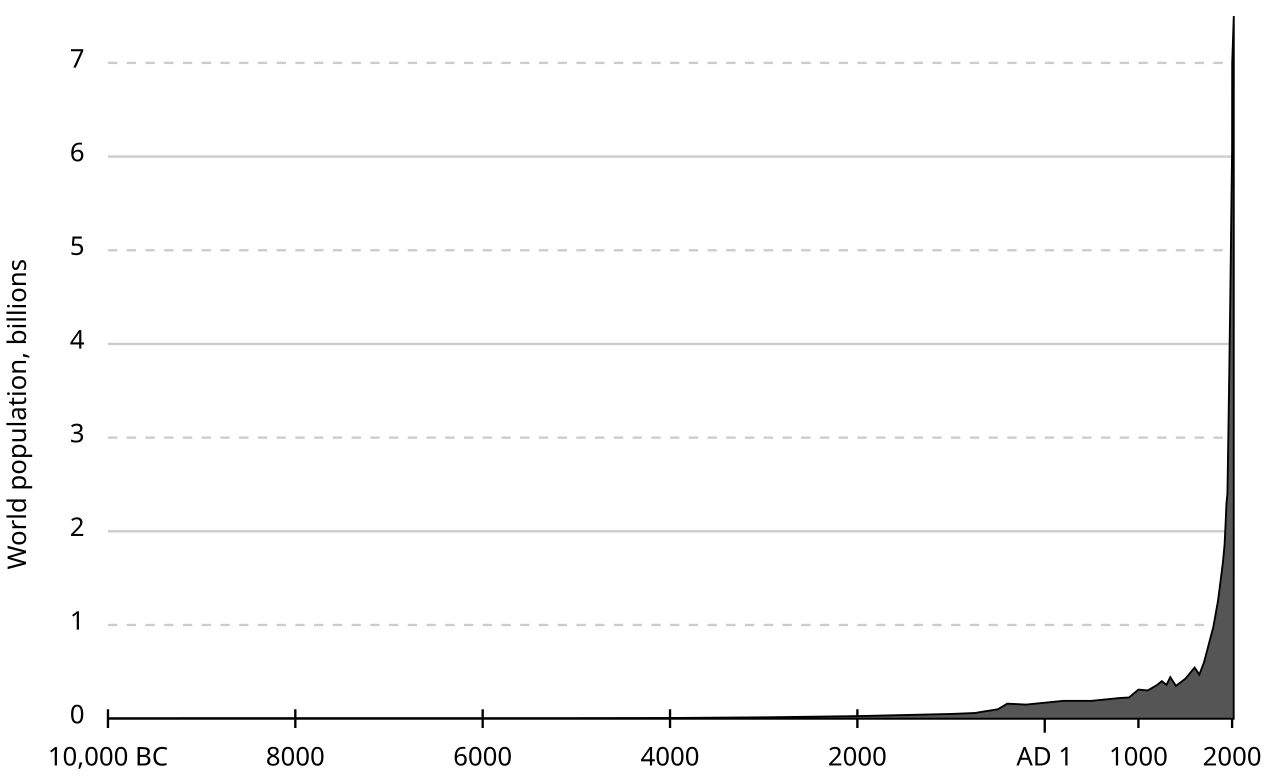
| الوصف | World human population (est.) 10,000 BC–2000 AD. |
| المصدر | originally uploaded to en.wikipedia as Population curve.svg. The data is from the "lower" estimates at census.gov (archive.org mirror). |
| المؤلف | El T |
| إصدارات أخرى | File:Population curve-ar.svg |
| وضع -El T في ويكيبيديا الإنجليزية-، وهو المؤلف، هذا العمل في النِّطاق العامِّ. يسري ذلك في كل أرجاء العالم. في بعض البلدان، قد يكون هذا التَّرخيص غيرَ مُمكنٍ قانونيَّاً، في هذه الحالة: يمنح El T الجميع حق استخدام هذا العمل لأي غرض دون أي شرط ما لم يفرض القانون شروطًا إضافية. |
Data
year   world population (millions)
-10000 4
-8000  5
-7000  5
-6000  5
-5000  5
-4000  7
-3000  14
-2000  27
-1000  50
-750   60
-500   100
-400   160
-200   150
1      170
200    190
400    190
500    190
600    200
700    210
800    220
900    226
1000   310
1100   301
1200   360
1250   400
1300   360
1340   443
1400   350
1500   425
1600   545
1650   470
1700   600
1750   790
1800   980
1850   1260
1900   1650
1910   1750
1920   1860
1930   2070
1940   2300
1950   2400
1960   3020
1970   3700
1974   4000
1980   4430
1987   5000
1990   5260
2000   6070
2000   6500 (July 2)*
2000   6747.5 (October 2)*
2001   7000 (March 15)*
2001   7000.025 (April 21)*

*) Data points as actually plotted in 2012-05-24 revision
   (exact X axis values are 2000.5, 2000.75, 2001.2 and 2001.3)
   These are probably incorrect.
Sources
- Biraben, Jean-Noel, 1980, An Essay Concerning Mankind's Evolution, Population, Selected Papers, December, table 2.
- Durand, John D., 1974, "Historical Estimates of World Population: An Evaluation," University of Pennsylvania, Population Center, Analytical and Technical Reports, Number 10, table 2.
- Haub, Carl, 1995, "How Many People Have Ever Lived on Earth?" Population Today, February, p. 5.
- McEvedy, Colin and Richard Jones, 1978, "Atlas of World Population History," Facts on File, New York, pp. 342-351.
- Thomlinson, Ralph, 1975, "Demographic Problems, Controversy Over Population Control," Second Edition, Table 1.
- United Nations (UN), 1973, The Determinants and Consequences ofPopulation Trends, Population Studies, No. 50., p.10.
- United Nations, 1999, The World at Six Billion, Table 1, "World Population From" Year 0 to Stabilization, p. 5, http://www.un.org/esa/population/publications/sixbillion/sixbilpart1.pdf
- U.S. Census Bureau (USCB), 2008, "Total Midyear Population for the World: 1950-2050", Data updated 12-15-2008, https://www.census.gov\/ipc/www/idb/worldpop.html
تاريخ الملف
اضغط على زمن/تاريخ لرؤية الملف كما بدا في هذا الزمن.
| زمن/تاريخ | صورة مصغرة | الأبعاد | مستخدم | تعليق | |
|---|---|---|---|---|---|
| حالي | 22:24، 15 أغسطس 2017 | | 547 × 332 (10 كيلوبايت) | Gregor Hagedorn | Updating to 2017/7.5 billion |
| 09:25، 21 يوليو 2015 |  | 550 × 325 (10 كيلوبايت) | JorisvS | Reverted to version as of 12:45, 24 May 2012: It breaks the text and numbers in the graph | |
| 18:44، 20 مايو 2015 |  | 2٬500 × 1٬478 (15 كيلوبايت) | GregKaye | moving to bronze age time scale | |
| 12:45، 24 مايو 2012 |  | 550 × 325 (10 كيلوبايت) | Spesh531 | Adding up to 7 billion, a year is .004 pixels | |
| 10:56، 10 نوفمبر 2006 |  | 550 × 275 (4 كيلوبايت) | Dangauthier |
استخدام الملف
الصفحتان التاليتان تستخدمان هذا الملف:
الاستخدام العالمي للملف
الويكيات الأخرى التالية تستخدم هذا الملف:
- الاستخدام في af.wikipedia.org
- الاستخدام في ast.wikipedia.org
- الاستخدام في az.wikipedia.org
- الاستخدام في be.wikipedia.org
- الاستخدام في bg.wikipedia.org
- الاستخدام في bn.wikipedia.org
- الاستخدام في ca.wikipedia.org
- الاستخدام في cs.wikipedia.org
- الاستخدام في cs.wikinews.org
- الاستخدام في da.wikipedia.org
- الاستخدام في da.wikibooks.org
- الاستخدام في de.wikipedia.org
- الاستخدام في el.wikipedia.org
- الاستخدام في en.wikipedia.org
- The Population Bomb
- I = PAT
- Demographic transition
- Paul R. Ehrlich
- Doomsday argument
- Environmental degradation
- Population growth
- Human impact on the environment
- Intraspecific competition
- Albert Allen Bartlett
- Andrey Korotayev
- Wikipedia:Reference desk/Archives/Humanities/2006 September 4
- Wikipedia:Reference desk/Archives/Miscellaneous/2006 October 2
- Estimates of historical world population
- Wikipedia:Graphics Lab/Images to improve/Archive/Mar 2008
- World population
- Talk:World population/Archive 1
- User talk:McSly/Archive 1
- User:Bigmadrich/sandbox
- User:I worship oil
- الاستخدام في en.wikibooks.org
- الاستخدام في en.wiktionary.org
- الاستخدام في eo.wikipedia.org
- الاستخدام في es.wikipedia.org
اعرض المزيد من الاستخدام العام لهذا الملف.