ملف:HRDiagram-Fr.png
حجم هذه المعاينة: 526 × 599 بكسل. الأبعاد الأخرى: 211 × 240 بكسل | 421 × 480 بكسل | 720 × 820 بكسل.
الملف الأصلي (720 × 820 بكسل حجم الملف: 21 كيلوبايت، نوع MIME: image/png)
| هذا ملف من ويكيميديا كومنز. معلومات من صفحة وصفه مبينة في الأسفل. كومنز مستودع ملفات ميديا ذو رخصة حرة. |
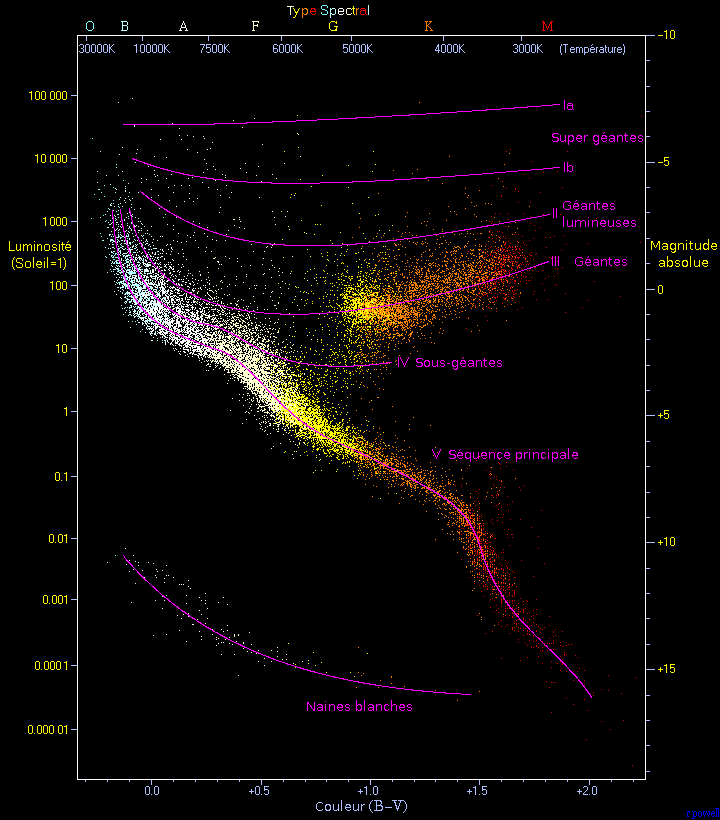
| الوصف | Hertzsprung-Russell diagram. A plot of luminosity (absolute magnitude) against the colour of the stars ranging from the high-temperature blue-white stars on the left side of the diagram to the low temperature red stars on the right side. "This diagram below is a plot of 22000 stars from the Hipparcos Catalogue together with 1000 low-luminosity stars (red and white dwarfs) from the Gliese Catalogue of Nearby Stars. The ordinary hydrogen-burning dwarf stars like the Sun are found in a band running from top-left to bottom-right called the Main Sequence. Giant stars form their own clump on the upper-right side of the diagram. Above them lie the much rarer bright giants and supergiants. At the lower-left is the band of white dwarfs - these are the dead cores of old stars which have no internal energy source and over billions of years slowly cool down towards the bottom-right of the diagram." Converted to png and compressed with pngcrush. |
| التاريخ | (UTC) |
| المصدر | |
| المؤلف |
|
| إصدارات أخرى |
[]
|


.png)


.svg)


.jpg)


| هذا رسمٌ مُعَدَّلٌ رقميَّاً من النسخة الأصليَّة. التعديلات هي: Fr_version. يُمكن الاطلاع على النسخة الأصليَّة هنا: HRDiagram.png:
|
أنا، صاحب حقوق التأليف والنشر لهذا العمل، أنشر هذا العمل تحت الرخصة التالية:
هذا الملف مُرخص تحت رخصة المشاع المبدع نسبة المصنف إلى مؤلفه - المشاركة على قدم المساواة 2.5 العامة
- يحقُّ لك:
- مشاركة العمل – نسخ العمل وتوزيعه وبثُّه
- إعادة إنتاج العمل – تعديل العمل
- حسب الشروط التالية:
- نسب العمل إلى مُؤَلِّفه – يلزم نسب العمل إلى مُؤَلِّفه بشكل مناسب وتوفير رابط للرخصة وتحديد ما إذا أجريت تغييرات. بالإمكان القيام بذلك بأية طريقة معقولة، ولكن ليس بأية طريقة تشير إلى أن المرخِّص يوافقك على الاستعمال.
- الإلزام بترخيص المُشتقات بالمثل – إذا أعدت إنتاج المواد أو غيرت فيها، فيلزم أن تنشر مساهماتك المُشتقَّة عن الأصل تحت ترخيص الأصل نفسه أو تحت ترخيص مُتوافِقٍ معه.
سجلُّ الرَّفع الأصيل
This image is a derivative work of the following images:
- File:HRDiagram.png licensed with Cc-by-sa-2.5
- 2007-03-03T03:42:55Z Falcorian 720x820 (19148 Bytes) {{Information |Description=Hertzsprung-Russell diagram. A plot of luminosity (absolute magnitude) against the colour of the stars ranging from the high-temperature blue-white stars on the left side of the diagram to the low t
Uploaded with derivativeFX
تاريخ الملف
اضغط على زمن/تاريخ لرؤية الملف كما بدا في هذا الزمن.
| زمن/تاريخ | صورة مصغرة | الأبعاد | مستخدم | تعليق | |
|---|---|---|---|---|---|
| حالي | 16:02، 10 مايو 2010 | | 720 × 820 (21 كيلوبايت) | Tachymètre | a translation was missing |
| 15:43، 2 مايو 2010 |  | 720 × 820 (19 كيلوبايت) | Leovilok | {{Information |Description=Hertzsprung-Russell diagram. A plot of luminosity (absolute magnitude) against the colour of the stars ranging from the high-temperature blue-white stars on the left side of the diagram to the low temperature red stars on the ri |
استخدام الملف
الصفحة التالية تستخدم هذا الملف:
الاستخدام العالمي للملف
الويكيات الأخرى التالية تستخدم هذا الملف:
- الاستخدام في ca.wikipedia.org
- الاستخدام في fr.wikipedia.org
- الاستخدام في ro.wikipedia.org